
Listen to this article
Supply and Demand Study Guide
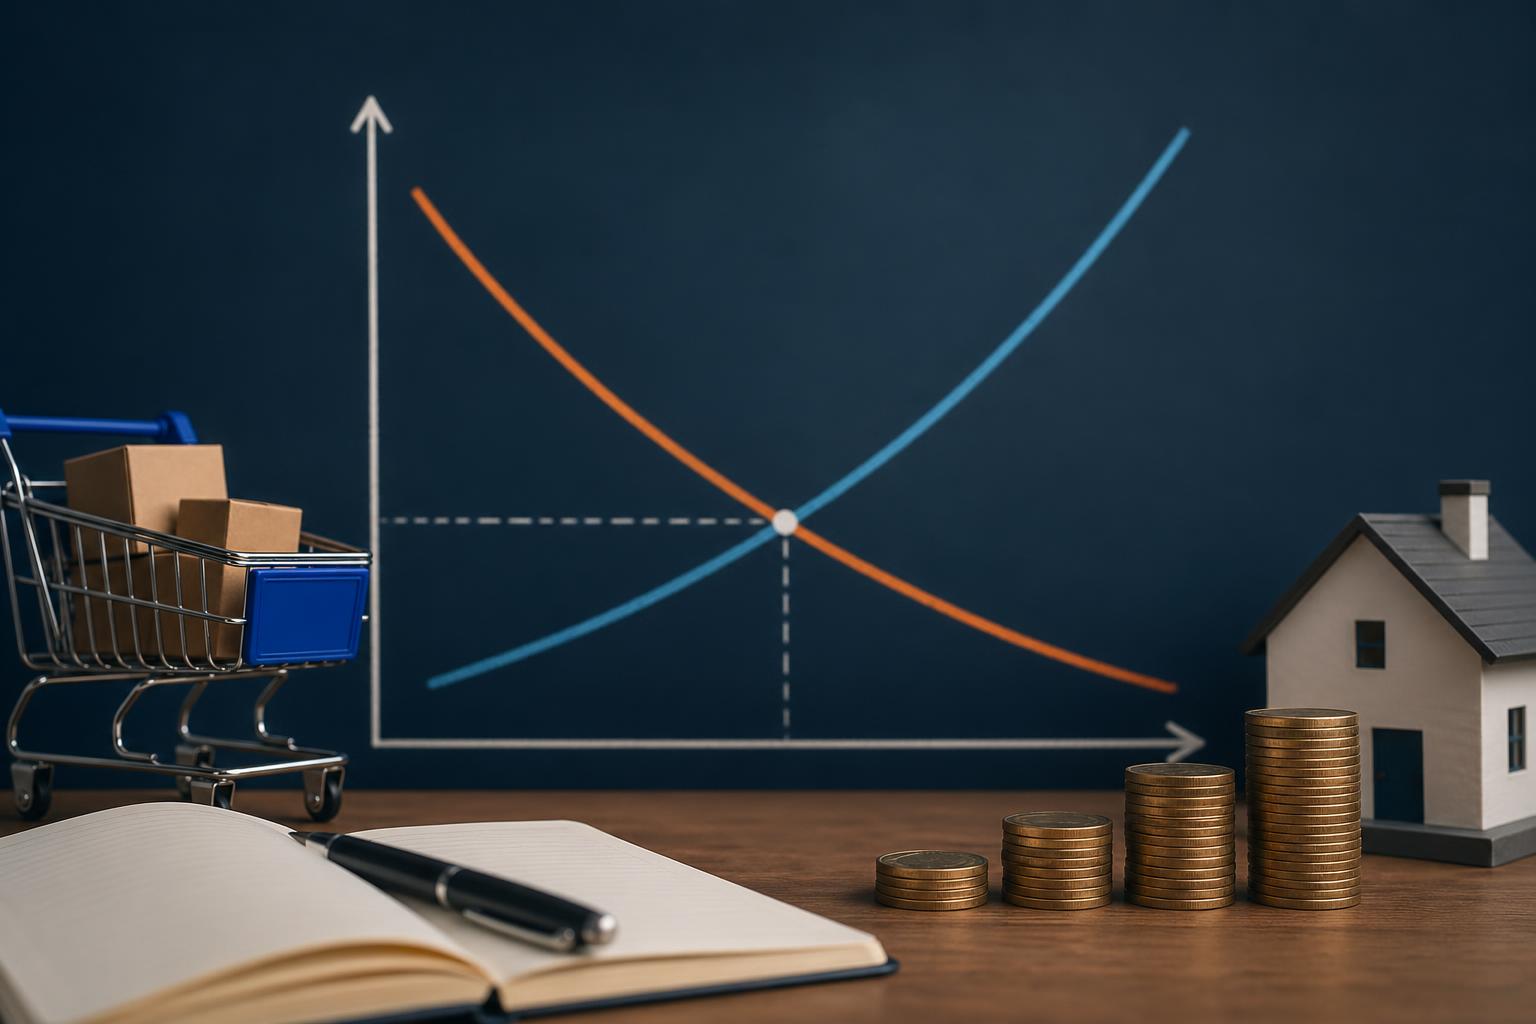
This supply and demand study guide explains one of the most important ideas in economics: how buyers and sellers interact to determine prices and quantities in a market. When demand changes, consumers want more or less of a good at each price. When supply changes, producers are willing to sell more or less at each price. The point where the two curves meet is market equilibrium, which helps explain shortages, surpluses, and price movements. Use these supply and demand notes, summary points, flashcards, and quiz questions to review core definitions, graph shifts, and real-world examples for class and exams.
Key takeaways
- Demand shows how much consumers are willing and able to buy at different prices, usually with an inverse relationship between price and quantity demanded.
- Supply shows how much producers are willing and able to sell at different prices, usually with a direct relationship between price and quantity supplied.
- Market equilibrium occurs where quantity demanded equals quantity supplied, setting the equilibrium price and quantity.
- Shifts in demand or supply are caused by factors other than the good’s own price, such as income, input costs, technology, expectations, and number of buyers or sellers.
- A price above equilibrium creates a surplus, while a price below equilibrium creates a shortage.
- Understanding how curves move helps students predict what happens in markets after economic changes or government policies.
What Supply and Demand Mean
Supply and demand are the basic forces that organize most markets. Demand refers to the quantities of a good or service that consumers are willing and able to purchase at various prices during a given period. The law of demand states that, all else equal, as price rises, quantity demanded falls; as price falls, quantity demanded rises. Supply refers to the quantities producers are willing and able to offer for sale at various prices. The law of supply states that, all else equal, as price rises, quantity supplied rises; as price falls, quantity supplied falls. These relationships are often shown with a downward-sloping demand curve and an upward-sloping supply curve.
Equilibrium, Shortage, and Surplus
The equilibrium price is the price at which quantity demanded equals quantity supplied. The equilibrium quantity is the amount bought and sold at that price. If the market price is above equilibrium, producers supply more than consumers want to buy, creating a surplus. Surpluses usually push prices downward. If the market price is below equilibrium, consumers want to buy more than producers are willing to sell, creating a shortage. Shortages usually push prices upward. This adjustment process helps explain how markets move toward equilibrium over time, although real markets may take time to adjust.
Movements Along Curves vs. Shifts of Curves
A change in the good’s own price causes a movement along a curve, not a shift. For demand, a lower price leads to an increase in quantity demanded, while a higher price leads to a decrease in quantity demanded. For supply, a higher price leads to an increase in quantity supplied, while a lower price leads to a decrease in quantity supplied. A shift happens when another factor changes. Demand can shift because of changes in income, tastes, expectations, the prices of related goods, or the number of buyers. Supply can shift because of changes in input costs, technology, taxes, subsidies, expectations, or the number of sellers. Keeping this distinction clear is essential for graphing and test questions.
Real-World Applications of Supply and Demand
Supply and demand help explain events in everyday life. If a new smartphone becomes highly popular, demand shifts right, increasing equilibrium price and quantity if supply stays the same. If a drought reduces crop output, supply shifts left, raising prices and lowering equilibrium quantity. If technology makes production cheaper, supply shifts right, which tends to lower prices and raise quantity sold. Government actions also matter: a price ceiling set below equilibrium can create shortages, while a price floor set above equilibrium can create surpluses. By applying the model to current events, students can better understand inflation, housing markets, labor markets, and consumer goods pricing.
Flashcards
What does demand represent in economics?
The quantities consumers are willing and able to buy at different prices.
What does the law of demand state?
As price rises, quantity demanded falls, all else equal.
What does supply represent in economics?
The quantities producers are willing and able to sell at different prices.
What does the law of supply state?
As price rises, quantity supplied rises, all else equal.
What is market equilibrium?
The point where quantity demanded equals quantity supplied.
What happens when price is above equilibrium?
A surplus occurs because quantity supplied exceeds quantity demanded.
Name one factor that can shift demand.
A change in consumer income can shift demand.
Name one factor that can shift supply.
A change in input costs can shift supply.
Quiz
1. What is the equilibrium price?
- A. The highest price consumers will pay
- B. The price where quantity demanded equals quantity supplied
- C. The price set only by producers
- D. The average of all market prices
Show answer
Answer: The price where quantity demanded equals quantity supplied
Equilibrium occurs at the intersection of the supply and demand curves, where the quantity buyers want matches the quantity sellers offer.
2. If the price of a good falls, what usually happens according to the law of demand?
- A. Quantity demanded decreases
- B. Quantity demanded increases
- C. Supply shifts left
- D. Demand shifts right
Show answer
Answer: Quantity demanded increases
A lower price causes a movement along the demand curve, leading consumers to buy more of the good.
3. Which of the following is most likely to shift the supply curve?
- A. A change in the good’s own price
- B. A change in production technology
- C. A change in quantity supplied
- D. A movement along the curve
Show answer
Answer: A change in production technology
Improved technology can lower production costs and shift supply to the right.
4. What does a shortage mean in a market?
- A. Quantity supplied is greater than quantity demanded
- B. Quantity demanded is greater than quantity supplied
- C. Price is at equilibrium
- D. Supply and demand shift equally
Show answer
Answer: Quantity demanded is greater than quantity supplied
A shortage happens when buyers want more than sellers are willing to provide at the current price.
5. If consumer income rises and the good is normal, what is the most likely result?
- A. Demand shifts left
- B. Demand shifts right
- C. Supply shifts left
- D. Quantity supplied decreases
Show answer
Answer: Demand shifts right
For a normal good, higher income increases consumers’ willingness and ability to buy, shifting demand right.
FAQs
What is the difference between a change in demand and a change in quantity demanded?
A change in demand means the entire demand curve shifts because of a factor like income, tastes, or expectations. A change in quantity demanded means movement along the same demand curve caused only by a change in the good’s own price.
Why do supply and demand curves slope in opposite directions?
Demand curves generally slope downward because consumers buy more at lower prices and less at higher prices. Supply curves generally slope upward because producers are usually willing to supply more when prices are higher and production becomes more profitable.
How do shortages and surpluses affect prices?
Shortages tend to push prices upward because buyers compete for limited goods. Surpluses tend to push prices downward because sellers lower prices to attract buyers and reduce unsold inventory.
Study smarter with AI
Turn this supply and demand study guide into personalized practice with AI Study Assistant. Generate custom explanations, review your supply and demand notes, and quiz yourself before your next economics test.

Leave a Reply