
Listen to this article
Statistics Basics Study Guide
Statistics is the branch of math used to collect, organize, analyze, and interpret data. A strong statistics basics study guide helps you understand how numbers can describe real-world patterns, compare groups, measure uncertainty, and support decisions. In this guide, you will review key statistics notes on data types, descriptive statistics, probability, sampling, graphs, and basic inference, then reinforce the ideas with statistics flashcards and a statistics quiz.
Key takeaways
- Statistics is used to collect, summarize, analyze, and interpret data so that patterns and conclusions are easier to understand.
- Data can be categorical or quantitative, and the type of data affects which graphs, summaries, and calculations are appropriate.
- Measures of center, such as mean, median, and mode, describe typical values, while measures of spread, such as range, variance, and standard deviation, describe variability.
- Probability provides the foundation for understanding chance, uncertainty, sampling, and statistical inference.
- Good samples should represent the population; biased sampling can lead to misleading conclusions.
- Graphs such as bar charts, histograms, box plots, and scatterplots help reveal distributions, comparisons, outliers, and relationships.
What Statistics Studies
Statistics focuses on learning from data. A population is the entire group you want to study, while a sample is a smaller group selected from that population. For example, if a school wants to know the average study time of all students, all students are the population; 100 surveyed students would be a sample. A parameter is a number that describes a population, such as the true average study time of all students. A statistic is a number calculated from a sample, such as the average study time of the 100 surveyed students. Because samples vary, statistics are used to estimate unknown population values.
Types of Data and Variables
Data can be classified in several ways. Categorical data describe groups or labels, such as eye color, favorite subject, or class year. Quantitative data are numerical and measure amounts, such as height, test score, or time spent studying. Quantitative data can be discrete, meaning countable values such as number of siblings, or continuous, meaning values that can fall anywhere in a range, such as weight or temperature. Understanding the variable type helps you decide whether to use frequency tables, bar graphs, histograms, averages, or other statistical tools.
Descriptive Statistics: Center and Spread
Descriptive statistics summarize data. Measures of center describe a typical value. The mean is found by adding all values and dividing by the number of values. The median is the middle value when data are ordered. The mode is the most frequent value. Measures of spread describe how much values vary. The range is the maximum minus the minimum. Variance and standard deviation measure average distance from the mean, with standard deviation being easier to interpret because it uses the original units. If data contain extreme outliers, the median and interquartile range are often more useful than the mean and range.
Graphs and Data Displays
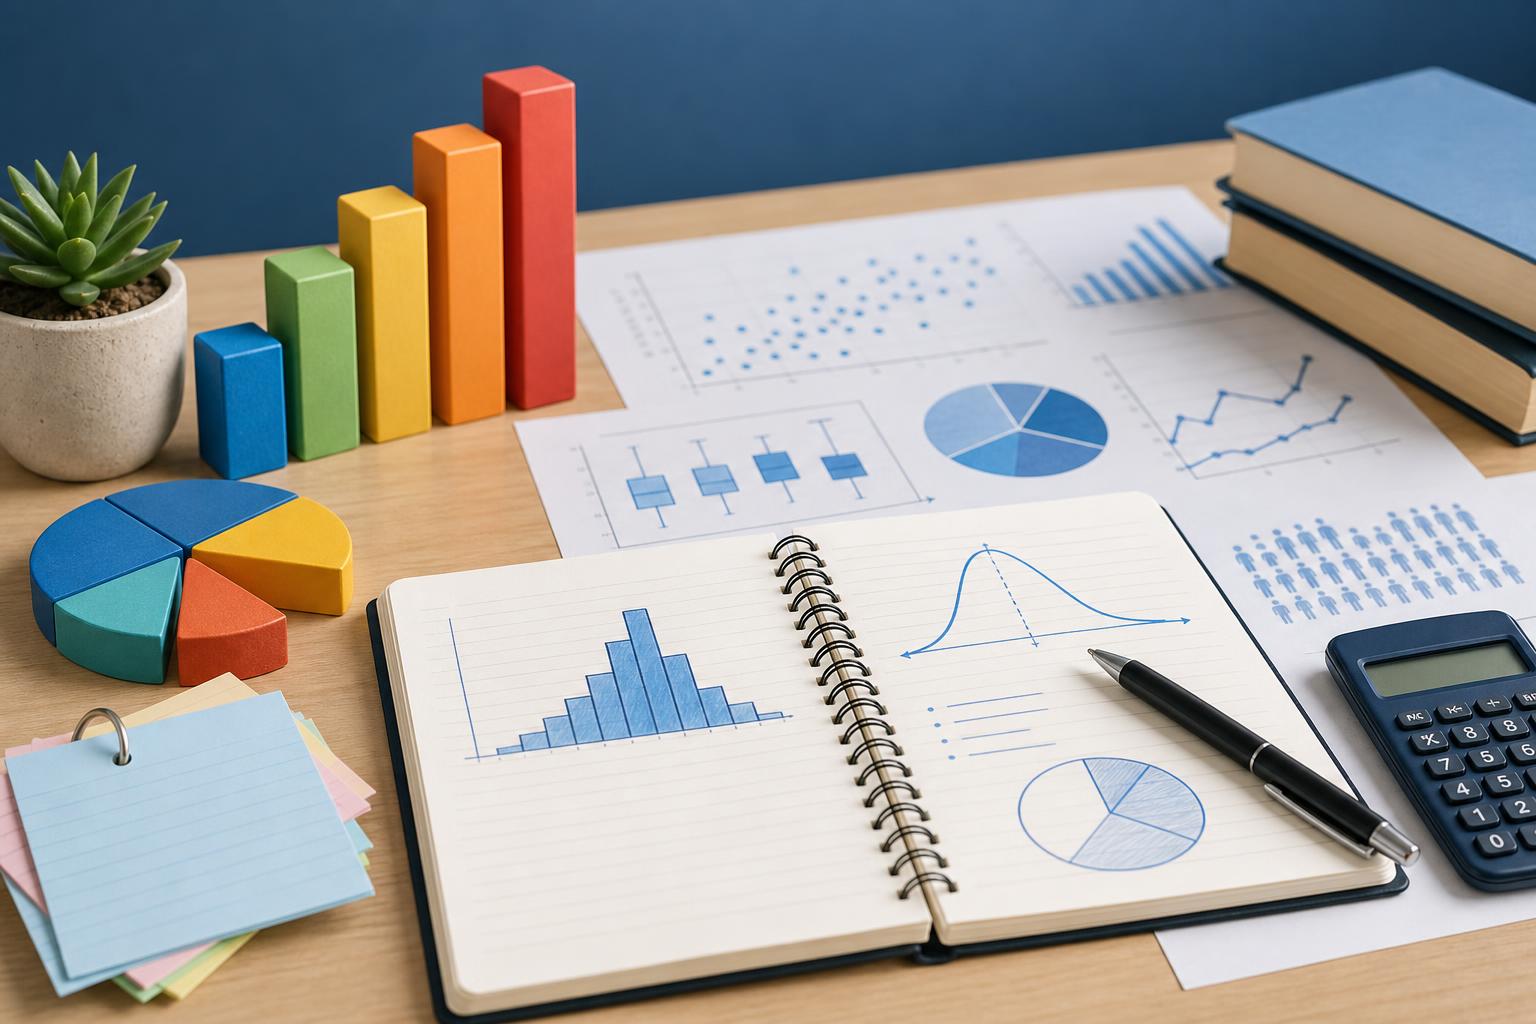
Graphs make patterns easier to see. Bar charts compare categories, such as the number of students choosing each favorite sport. Pie charts show parts of a whole, though they are best when there are only a few categories. Histograms show the distribution of quantitative data by grouping values into intervals. Box plots summarize the minimum, first quartile, median, third quartile, and maximum, making them useful for comparing spread and detecting outliers. Scatterplots display pairs of quantitative variables and help identify relationships, trends, clusters, and possible correlations.
Probability Basics
Probability measures how likely an event is to occur, using values from 0 to 1. A probability of 0 means impossible, and a probability of 1 means certain. The probability of an event is often calculated as favorable outcomes divided by total possible outcomes, assuming all outcomes are equally likely. Complementary events are opposites, so the probability of an event not happening is 1 minus the probability that it happens. Independent events do not affect each other, such as flipping a coin twice. Dependent events do affect each other, such as drawing cards without replacement.
Sampling and Introductory Inference
Sampling is the process of selecting part of a population to study. A random sample gives each member of the population a chance of being selected and helps reduce bias. Biased samples occur when the sampling method overrepresents or underrepresents certain groups. Statistical inference uses sample data to make conclusions about a population. Although introductory statistics often begins with descriptive summaries, inference adds ideas such as estimation, margin of error, confidence intervals, and hypothesis testing. The key idea is that conclusions are stronger when data are collected carefully and analyzed appropriately.
Flashcards
What is statistics?
Statistics is the study of collecting, organizing, analyzing, and interpreting data.
What is the difference between a population and a sample?
A population is the entire group being studied, while a sample is a smaller part of that population.
What does the mean measure?
The mean measures the average value by adding all data values and dividing by the number of values.
When is the median especially useful?
The median is especially useful when data contain outliers or are strongly skewed.
What does standard deviation describe?
Standard deviation describes how spread out data values are from the mean.
What type of graph is best for showing the distribution of quantitative data?
A histogram is commonly used to show the distribution of quantitative data.
What is probability?
Probability is a measure of how likely an event is to occur, ranging from 0 to 1.
What is a biased sample?
A biased sample is a sample that does not fairly represent the population being studied.
Quiz
1. Which statement best describes a sample in statistics?
- A. The entire group being studied
- B. A smaller group selected from a population
- C. A value that describes a whole population
- D. A graph used to display categories
Show answer
Answer: A smaller group selected from a population
A sample is a subset of the population used to collect data and make estimates about the larger group.
2. Which measure of center is found by adding all values and dividing by the number of values?
- A. Mean
- B. Median
- C. Mode
- D. Range
Show answer
Answer: Mean
The mean is the arithmetic average of a data set.
3. Which measure is most affected by extreme outliers?
- A. Median
- B. Mode
- C. Mean
- D. Interquartile range
Show answer
Answer: Mean
The mean uses every value in the data set, so very high or very low outliers can pull it away from the center.
4. Which graph is most appropriate for displaying categorical data?
- A. Histogram
- B. Bar chart
- C. Scatterplot
- D. Box plot
Show answer
Answer: Bar chart
Bar charts compare frequencies or amounts across categories.
5. What is the range of the data set 4, 7, 9, 10, 15?
- A. 5
- B. 7
- C. 9
- D. 11
Show answer
Answer: 11
The range is the maximum minus the minimum, so 15 minus 4 equals 11.
6. If the probability of rain is 0.30, what is the probability that it does not rain?
- A. 0.03
- B. 0.30
- C. 0.70
- D. 1.30
Show answer
Answer: 0.70
The complement of an event has probability 1 minus the event probability, so 1 – 0.30 = 0.70.
7. Which term describes numerical data that can take any value within a range?
- A. Categorical data
- B. Continuous data
- C. Nominal data
- D. Biased data
Show answer
Answer: Continuous data
Continuous data can take values along a scale, such as height, time, or temperature.
FAQs
What should I learn first in statistics basics?
Start with populations, samples, variables, data types, measures of center, and measures of spread. These ideas form the foundation for graphs, probability, sampling, and inference.
How do I know whether to use mean or median?
Use the mean when data are roughly balanced and do not have major outliers. Use the median when data are skewed or include extreme values because the median is more resistant to outliers.
Why is probability important in statistics?
Probability helps statisticians understand uncertainty. It supports ideas such as random sampling, expected outcomes, confidence intervals, and hypothesis tests.
How can I study statistics more effectively?
Practice interpreting real data sets, make your own statistics notes, solve calculation problems step by step, and test yourself with statistics flashcards and a statistics quiz after each topic.
Next step
Turn this topic into a study session with notes, flashcards, and a practice quiz built from your own class material.

Leave a Reply