
Listen to this article
Functions and Graphs Study Guide
This functions and graphs study guide gives students a clear, practical review of one of the most important ideas in math: how inputs and outputs are related and how those relationships appear on a graph. You will learn how to recognize a function, read and compare graphs, identify domain and range, connect equations to visual patterns, and understand common transformations. Use these functions notes, graphs summary, functions and graphs flashcards, and quiz questions to strengthen core algebra skills and prepare for homework, tests, and class review.
Key takeaways
- A function assigns exactly one output to each input.
- Graphs help you visualize patterns such as slope, intercepts, increasing behavior, and symmetry.
- Domain describes possible input values, while range describes possible output values.
- Function rules can be represented in multiple ways, including equations, tables, mappings, and graphs.
- Transformations such as shifts, reflections, and stretches change the appearance of a graph in predictable ways.
What Is a Function?
A function is a rule that matches each input value, usually called x, with exactly one output value, usually called y. If one input is paired with two different outputs, the relation is not a function. Functions can be written as equations such as y = 2x + 3, shown in a table of values, represented with ordered pairs, or displayed on a graph. A useful way to test a graph is the vertical line test: if any vertical line crosses the graph more than once, the graph does not represent a function. This idea is central because functions model real situations such as cost, distance, temperature, and population change.
Reading Graphs of Functions
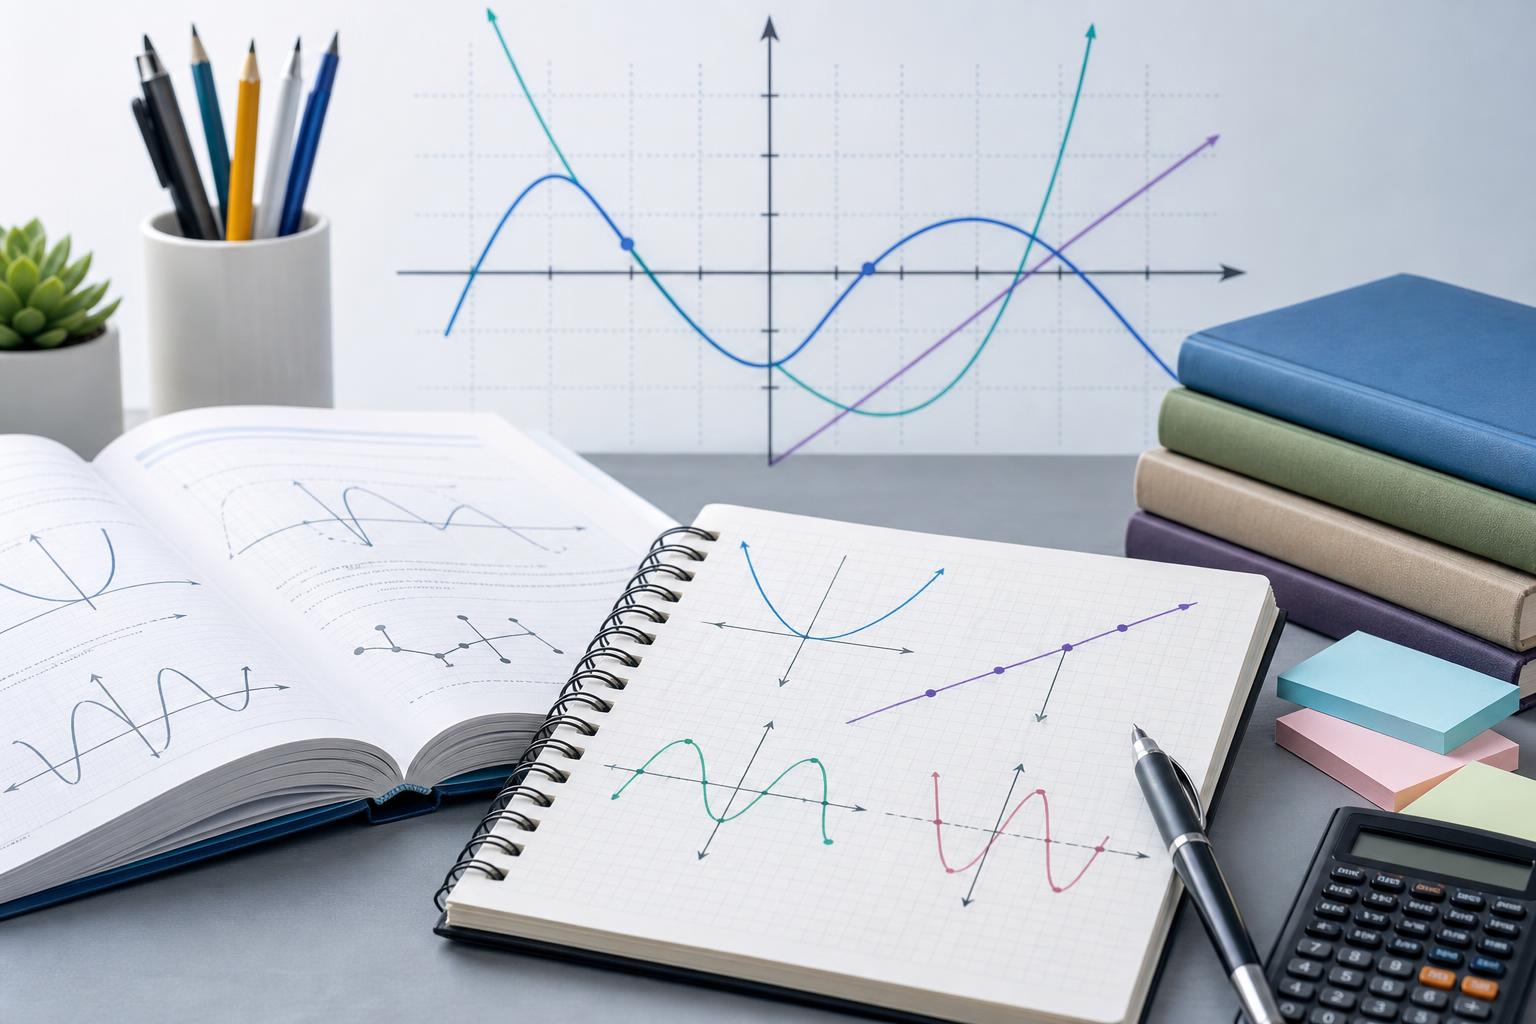
Graphs show how y changes as x changes. Important features include the x-intercepts, where the graph crosses the x-axis; the y-intercept, where it crosses the y-axis; intervals where the function is increasing or decreasing; and any maximum or minimum points. You should also notice whether the graph is linear, curved, steep, flat, continuous, or broken into pieces. A straight line usually represents a constant rate of change, while curves often show changing rates. By reading the graph carefully, students can estimate values, compare functions, and understand behavior without relying only on formulas.
Domain, Range, and Function Notation
The domain of a function is the set of all allowable x-values, and the range is the set of all resulting y-values. For example, in the function y = 1/x, x cannot equal 0, so 0 is excluded from the domain. In function notation, f(x) means the output of the function f for the input x. If f(x) = x^2 + 1, then f(3) = 3^2 + 1 = 10. Students should practice moving between notation, tables, and graphs because these forms all describe the same relationship. Understanding domain and range helps when interpreting real-world restrictions and deciding which values make sense.
Common Graph Types and Transformations
Some common parent functions include linear functions like y = x, quadratic functions like y = x^2, absolute value functions like y = |x|, and exponential functions like y = 2^x. Each has a recognizable graph shape. Transformations change the parent graph in predictable ways. Adding a number outside the function, as in y = x^2 + 4, shifts the graph up. Subtracting shifts it down. Replacing x with x – 3 shifts the graph right, while x + 3 shifts it left. A negative sign in front reflects the graph across the x-axis. Multiplying by a number greater than 1 causes a vertical stretch, making the graph steeper or narrower depending on the function type. Knowing these patterns makes graphing faster and more accurate.
Flashcards
What makes a relation a function?
Each input has exactly one output.
What does the vertical line test check?
Whether a graph represents a function by seeing if any vertical line intersects it more than once.
What is the domain of a function?
The set of all possible input values.
What is the range of a function?
The set of all possible output values.
What is an x-intercept?
A point where the graph crosses the x-axis.
If f(x) = x^2 + 1, what is f(2)?
5
How does y = x^2 + 3 compare to y = x^2?
It is shifted up 3 units.
How does y = -(x^2) compare to y = x^2?
It is reflected across the x-axis.
Quiz
1. Which statement correctly describes a function?
- A. Each input has exactly one output
- B. Each output has exactly one input
- C. A graph must be a straight line
- D. Every relation is a function
Show answer
Answer: Each input has exactly one output
A relation is a function when no input is paired with more than one output. Outputs may repeat, and functions do not need to be straight lines.
2. What does the range of a function describe?
- A. All possible input values
- B. All possible output values
- C. The slope of the graph
- D. The x-intercepts only
Show answer
Answer: All possible output values
The range is the set of y-values the function can produce, while the domain is the set of x-values allowed.
3. What happens to the graph of y = x^2 when it becomes y = x^2 – 4?
- A. It shifts up 4 units
- B. It shifts down 4 units
- C. It shifts left 4 units
- D. It shifts right 4 units
Show answer
Answer: It shifts down 4 units
Subtracting 4 outside the function moves the entire graph vertically downward by 4 units.
4. Which graph would fail the vertical line test?
- A. A straight line with positive slope
- B. A parabola opening upward
- C. A circle
- D. An exponential curve
Show answer
Answer: A circle
A vertical line can cross a circle at two points, so a circle does not represent a function of x.
5. If f(x) = 2x + 1, what is f(4)?
- A. 7
- B. 8
- C. 9
- D. 10
Show answer
Answer: 9
Substitute x = 4 into the function: f(4) = 2(4) + 1 = 9.
FAQs
Why are functions and graphs important in math?
Functions and graphs help students describe relationships between quantities, predict values, and model real-world situations. They are foundational in algebra, geometry, calculus, science, and economics.
How can I tell if a graph is increasing or decreasing?
Read the graph from left to right. If the y-values rise, the function is increasing. If the y-values fall, the function is decreasing.
What is the easiest way to study functions notes and graphs summary material?
Study by connecting representations: write the equation, make a small table, plot points, and describe the graph's key features. Then test yourself using flashcards and a short quiz.
Study smarter with AI
Turn this functions and graphs study guide into personalized practice with AI Study Assistant. Review notes, generate extra examples, and quiz yourself on graph features, domain, range, and transformations.

Leave a Reply